


Managing Risk Using Technical Analysis
The world of investing can be volatile and unpredictable, making risk management a crucial component of any successful investment strategy. When it comes to managing risk, technical analysis is a powerful tool that can provide valuable insights to help investors make more informed decisions. By utilizing technical analysis techniques, investors can better assess potential risks and protect themselves against market uncertainties.
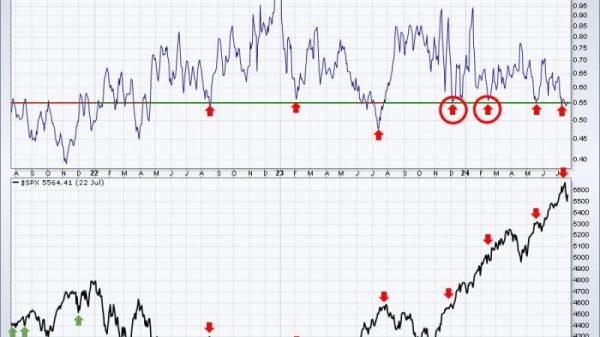
Identifying key support and resistance levels is one of the fundamental principles of technical analysis. Support levels represent points at which a security has historically had difficulty falling below, while resistance levels denote points at which a security has struggled to surpass. By understanding these levels, investors can set stop-loss orders and profit targets to limit potential losses and maximize gains.
Another important aspect of risk management through technical analysis is the use of moving averages. Moving averages help smooth out price fluctuations and provide a clearer picture of a security’s overall trend. By comparing different moving averages, investors can identify potential entry and exit points, as well as gauge the strength of a trend. For instance, a security trading above its 200-day moving average may indicate a long-term uptrend, while a move below the 50-day moving average could signal a short-term decline.
Furthermore, technical indicators such as the Relative Strength Index (RSI) and the Moving Average Convergence Divergence (MACD) can help investors assess the momentum and strength of a security’s price movements. The RSI measures whether a security is overbought or oversold, indicating possible reversal points, while the MACD highlights changes in a security’s trend. By incorporating these indicators into their analysis, investors can better anticipate potential price swings and adjust their risk management accordingly.
In addition to support and resistance levels, moving averages, and technical indicators, investors can also utilize chart patterns to manage risk effectively. Chart patterns, such as head and shoulders, double tops, and triangles, can offer valuable insights into potential price movements. By recognizing these patterns and understanding their implications, investors can make more informed decisions about when to enter or exit a trade, thereby reducing their exposure to risk.
Overall, employing technical analysis techniques can significantly enhance an investor’s ability to manage risk in the financial markets. By identifying key support and resistance levels, using moving averages and technical indicators, and recognizing chart patterns, investors can make more informed decisions and protect their capital against market uncertainties. While no strategy can eliminate risk entirely, incorporating technical analysis into an investment approach can help mitigate potential losses and improve overall performance in the long run.