


Market breadth indicators are crucial tools for investors to assess the health and direction of the stock market. These indicators provide valuable insights into the overall strength of the market by analyzing the number of advancing and declining stocks, volume, and other factors. One key market breadth indicator to watch is the advance-decline line (ADL). This indicator calculates the difference between advancing and declining stocks on a given day.
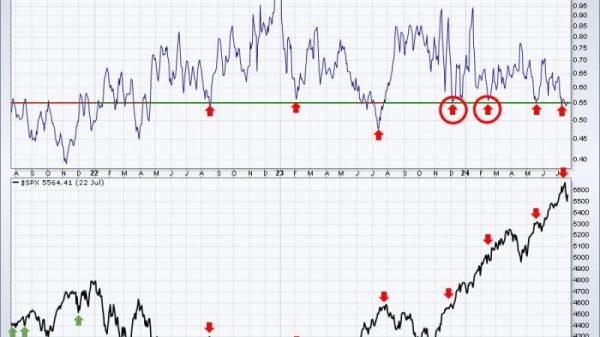
A significant aspect of the ADL is its ability to confirm or refute the strength of a market trend. If the ADL is moving in the same direction as the market index, it suggests that the trend is well-supported by a broad base of stocks. Conversely, if the ADL is diverging from the market index, it may signal a weakening trend and potential market reversal.
Tracking the ADL over multiple days can provide valuable information about the sustainability of a market move. Three consecutive down days in the ADL can indicate a shift in market sentiment towards negative territory. This decline in market breadth could be a warning sign for investors to exercise caution and potentially reevaluate their investment strategies.
Another essential market breadth indicator is the new high-new low index (NH-NL). This indicator tracks the number of stocks reaching new highs versus new lows over a specific period. A high number of new highs relative to new lows suggests a healthy market, while a higher number of new lows may indicate internal weakness in the market.
By examining the NH-NL index alongside the ADL, investors can gain a more comprehensive view of market breadth. If both indicators are trending downwards simultaneously over a few days, it could signal a broader market correction or potential downturn.
Volume analysis is also crucial in evaluating market breadth. High trading volume on up days signifies strong buying interest and broad participation in the market rally. Conversely, high volume on down days could indicate heightened selling pressure and potential market weakness.
In conclusion, monitoring market breadth indicators such as the ADL, NH-NL index, and volume can provide valuable insights into market dynamics and help investors make more informed decisions. By paying close attention to trends and patterns in these indicators, investors can gain a better understanding of market sentiment and anticipate potential market movements. Remember that market breadth indicators are just one tool in the investor’s toolkit and should be used in conjunction with other analysis techniques for a comprehensive investment strategy.