


In the world of financial markets, the quest to predict whether an asset has reached its bottom or not is a constant challenge for traders and investors. This analysis often involves studying various indicators and charts to make informed decisions. In this article, we will explore three key charts that can help in the assessment of whether a market or asset has bottomed out.
**Chart 1: Support and Resistance Levels**
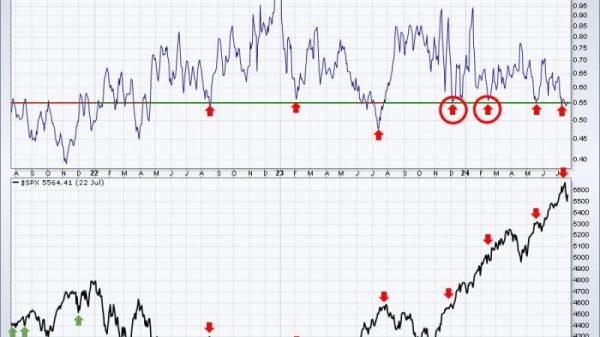
Support and resistance levels are crucial in technical analysis as they signify key price points where a particular asset may find buying or selling pressure. In the context of identifying a bottom, a break below a major support level followed by a bounce back above it could indicate a potential bottoming pattern. Traders often look for multiple touches at a support level to confirm its significance in determining a possible bottom.
**Chart 2: Volume Patterns**
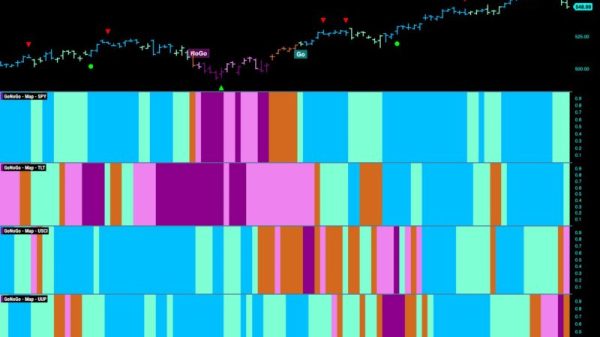
Volume analysis is another essential tool in determining market bottoms. A surge in trading volume near a potential bottom could signal increased interest from buyers, indicating a possible reversal in the trend. Conversely, a lack of volume at a bottom may suggest a lack of conviction from market participants, casting doubt on the sustainability of the bottom formation.
**Chart 3: Moving Averages**
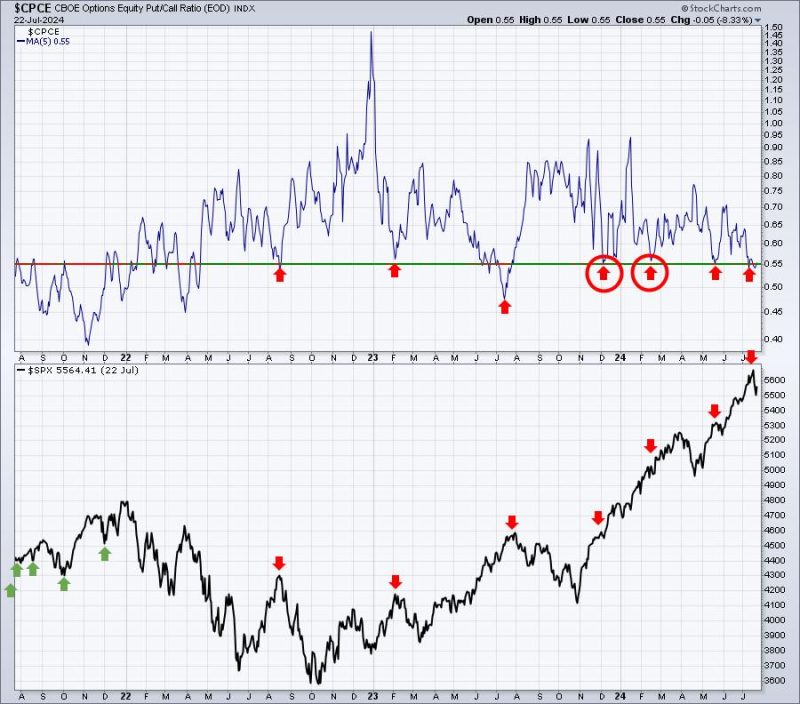
Moving averages are widely used to smooth out price data and identify trends over a specific period. The crossover of short-term moving averages above long-term moving averages, such as the 50-day crossing above the 200-day moving average, is often seen as a bullish signal by technical analysts. This golden cross can indicate a potential bottom in the price action of an asset.
In conclusion, the analysis of support and resistance levels, volume patterns, and moving averages can provide valuable insights into whether a market or asset has bottomed out. While these charts are essential tools in technical analysis, it is crucial to remember that no indicator is foolproof, and market bottoms can be elusive. Therefore, it is advisable to combine these charting techniques with thorough fundamental analysis and risk management strategies to make well-informed investment decisions.