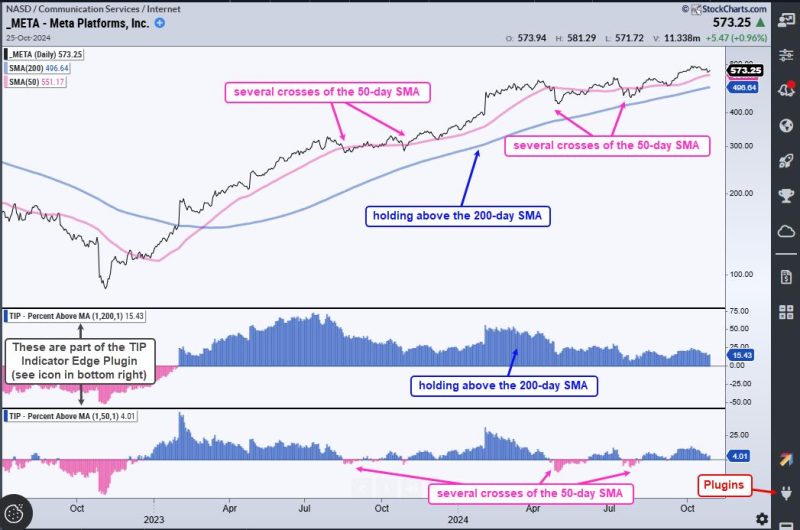
In today’s highly competitive financial markets, traders are constantly seeking ways to gain an edge and improve their profitability. While there are countless strategies and indicators available to traders, two specific indicators stand out as reliable tools for enhancing trading performance.
The first key indicator for improving your edge in trading is the Moving Average Convergence Divergence (MACD) indicator. Developed by Gerald Appel in the late 1970s, the MACD is a popular momentum indicator that helps traders identify trend direction, momentum, and potential reversals. The MACD is calculated by subtracting the 26-day exponential moving average (EMA) from the 12-day EMA. The result is then plotted on a chart along with a signal line, which is typically a 9-day EMA of the MACD line.
Traders can use the MACD to generate buy and sell signals based on crossovers between the MACD line and the signal line. When the MACD line crosses above the signal line, it is considered a bullish signal indicating a potential uptrend. Conversely, a cross below the signal line is considered bearish and signals a potential downtrend. Additionally, traders can look for divergence between the MACD line and price action, which can indicate a potential trend reversal.
The second indicator that can help traders improve their edge is the Relative Strength Index (RSI). The RSI is a momentum oscillator that measures the speed and change of price movements. The RSI oscillates between 0 and 100 and is typically used to identify overbought and oversold conditions in the market.
When the RSI is above 70, it is considered overbought, suggesting that the asset may be due for a pullback. Conversely, when the RSI is below 30, it is considered oversold, indicating a potential buying opportunity. Traders can use the RSI to confirm trends and identify potential reversal points by looking for divergences between the RSI and price action.
Incorporating the MACD and RSI indicators into your trading strategy can provide valuable insights into market trends, momentum, and potential reversals. By using these indicators in conjunction with other technical analysis tools, traders can enhance their decision-making process and increase their edge in the market.
In conclusion, the MACD and RSI indicators are powerful tools that can help traders improve their edge and achieve greater success in the financial markets. By understanding how these indicators work and incorporating them into your trading strategy, you can gain valuable insights into market dynamics and make more informed trading decisions. Start incorporating these indicators into your trading toolkit today and watch your trading performance improve.


