


In the realm of stock market trading, successfully predicting market reversals is a highly sought-after skill. Numerous indicators and tools have been developed to help traders in identifying potential trend reversals. One such indicator that has gained popularity among traders is the Average Directional Index (ADX). This article will delve into how traders can spot big reversals using the ADX indicator.
### Understanding the ADX Indicator
Before diving into how the ADX indicator can be used to spot reversals, it is essential to understand what the indicator represents. The ADX is a technical analysis tool that measures the strength of a trend, regardless of its direction. Developed by J. Welles Wilder, the ADX is a part of the Directional Movement System, which also includes the Positive Directional Indicator (+DI) and the Negative Directional Indicator (-DI).
The ADX value typically ranges from 0 to 100, with the higher values indicating a strong trend and lower values suggesting a weak or ranging market. Traders often use the ADX to determine whether a stock is trending or not and to gauge the strength of that trend.
### Spotting Reversals with the ADX Indicator
1. **Crossing ADX and DI Lines**: One way to spot a potential reversal is through the crossing of the ADX line and the DI lines. When the ADX line crosses above both the +DI and -DI lines, it may signal an upcoming trend reversal. Similarly, when the ADX line crosses below both the DI lines, it could indicate a reversal in the opposite direction.
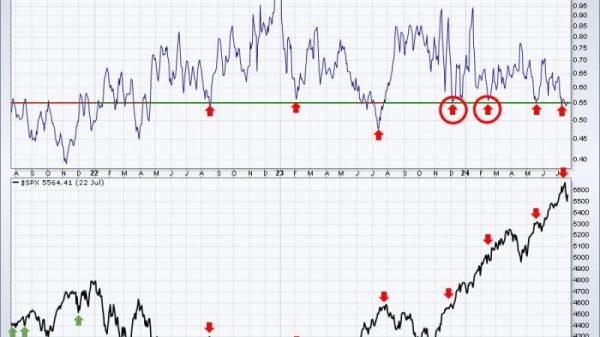
2. **Divergence in ADX and Price Action**: Another method traders use to identify potential reversals is by observing the divergence between the ADX line and the price action of the stock. If the price of the stock is making new highs or lows while the ADX is not confirming these movements, it could be a sign of a pending reversal.
3. **Extreme ADX Levels**: Monitoring the extreme levels of the ADX indicator can also provide insights into potential reversals. When the ADX reaches very high levels (e.g., above 50), it may indicate an overextended trend that is ripe for a reversal. Conversely, extremely low ADX values could suggest a weakening trend that might reverse soon.
### Putting it into Practice
To effectively utilize the ADX indicator for spotting reversals, it is crucial to combine it with other technical analysis tools and indicators. Traders should also consider factors such as volume, support and resistance levels, and market sentiment when making trading decisions based on the ADX signals.
In conclusion, the ADX indicator can be a valuable tool for traders seeking to identify potential trend reversals in the stock market. By understanding how to interpret ADX values and incorporating it into a comprehensive trading strategy, traders can gain an edge in predicting market reversals and making informed trading decisions.