


In the world of finance and trading, technical analysis plays a crucial role in determining potential market trends and outcomes. Traders often rely on various chart patterns and indicators to predict the direction of stock prices. One such phenomenon is the concept of failed bearish patterns turning into a bullish signal for the S&P 500 index.
The S&P 500 index, a benchmark index that tracks the performance of 500 large-cap stocks listed on U.S. exchanges, is closely monitored by investors and traders around the world. The index’s movements are often analyzed to gauge the overall health and direction of the stock market.
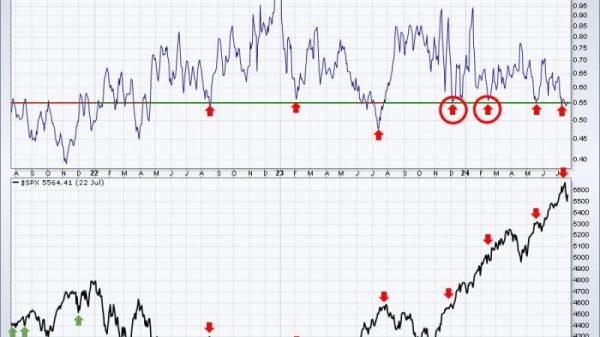
Failed bearish patterns occur when a technical analysis pattern that typically signals a downward trend fails to materialize, leading to a reversal in the opposite direction. These patterns can provide valuable insights into market sentiment and potential buying opportunities.
One common failed bearish pattern that traders often look out for is the head and shoulders pattern. This pattern is characterized by three peaks, with the middle peak (the head) being higher than the other two (the shoulders). In a traditional head and shoulders pattern, a breakdown below the neckline is expected to lead to a further decline in prices. However, when this breakdown fails to materialize, it can signal a potential reversal to the upside.
Another failed bearish pattern that traders pay attention to is the double top pattern. This pattern occurs when an asset reaches a peak price level, pulls back, rallies to a similar peak, and then fails to maintain the downward momentum. A failure of the double top pattern to result in a sustained decline can indicate a shift in market sentiment and potentially lead to an upward movement in prices.
When these failed bearish patterns emerge in the context of the S&P 500 index, traders often interpret them as a bullish signal for the broader market. The inability of these patterns to lead to sustained downward pressure suggests underlying strength in the market, prompting traders to reassess their bearish outlook and potentially enter long positions.
It is essential to note that while failed bearish patterns can provide valuable insights into market dynamics, they are not foolproof indicators of future price movements. Traders should always consider other factors such as fundamental analysis, market sentiment, and economic indicators when making trading decisions.
In conclusion, the phenomenon of failed bearish patterns turning into bullish signals for the S&P 500 index underscores the complexity and unpredictability of financial markets. By incorporating technical analysis into their trading strategies, investors can gain a deeper understanding of market trends and potentially capitalize on emerging opportunities.