


The global stock markets have experienced a period of impressive bullish momentum. However, investors and analysts now find themselves questioning when this upward trend may come to an end. Analyzing the following charts can provide valuable insights into potential signs of a shifting market sentiment:
1. Market Breadth Indicators:
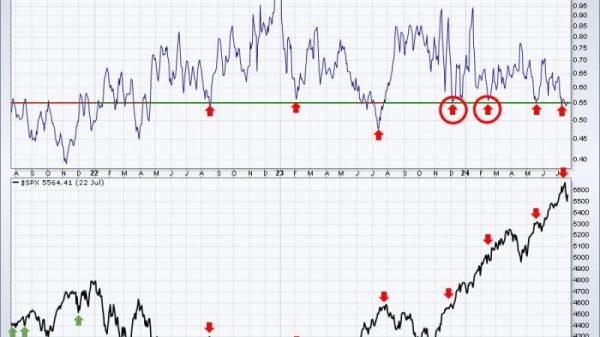
One key chart to watch is the market breadth indicator, which measures the overall health of the stock market by assessing the number of advancing versus declining stocks. A narrowing breadth can indicate weakening market internals and potential bearish sentiment on the horizon. Keep a close eye on this chart for any divergence between price movements and breadth indicators.
2. Relative Strength Index (RSI):
The RSI is a popular momentum oscillator that can signal overbought or oversold conditions in the market. When the RSI reaches extreme levels (typically above 70), it may suggest that the market is due for a correction. Conversely, a low RSI reading (below 30) could indicate an oversold market with potential buying opportunities. Monitoring the RSI chart can help investors gauge market sentiment and identify potential turning points.
3. Moving Averages:
Moving averages are essential tools for trend analysis and can help identify key support and resistance levels in the market. The 50-day and 200-day moving averages are commonly used to assess the overall trend direction. A crossover between these moving averages, known as the golden cross or death cross, can signal a potential shift in market momentum. Observing the moving average chart can provide valuable insights into the strength and sustainability of the current market trend.
4. Volatility Index (VIX):
The VIX, also known as the fear index, measures market volatility and investor sentiment. A spike in the VIX often coincides with increased market uncertainty and potential downside risk. Monitoring the VIX chart can help investors anticipate market turbulence and adjust their investment strategies accordingly.
In conclusion, staying informed and regularly monitoring these key charts can help investors navigate the dynamic stock market environment and anticipate potential shifts in market sentiment. By analyzing market breadth indicators, the RSI, moving averages, and the VIX, investors can make more informed decisions and better position themselves to capitalize on changing market conditions. Remember, the market is always evolving, and being proactive and prepared is essential for successful investing.