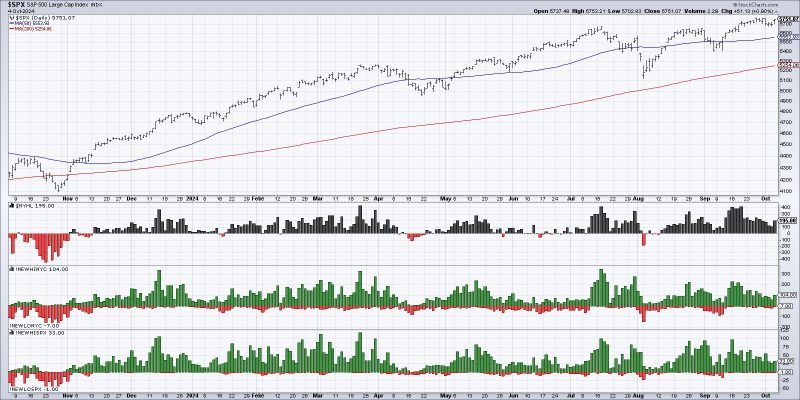
In the world of finance and investing, one term that often comes up is market breadth. Market breadth refers to the overall health and direction of a financial market, based on the number of individual companies or securities that are participating in a particular move. Broad market participation is considered a positive sign, indicating that the market rally or decline is supported by a wide range of stocks or securities.
Market breadth can be measured in various ways, such as the number of advancing versus declining stocks, the volume of shares traded in advancing stocks versus declining stocks, or the percentage of stocks trading above their moving averages. The concept of market breadth helps investors understand the underlying strength or weakness of a market trend.
Market breadth indicators are important tools for investors to gauge the overall market sentiment and potential future direction. For example, if a market is experiencing a strong rally, but market breadth is weak, with only a small number of stocks leading the gains while the majority are lagging behind, it may signal a lack of conviction and sustainability in the upward move.
Conversely, if a market is declining and market breadth is relatively strong, with a large number of stocks participating in the decline, it could indicate a broader-based correction or potential reversal in the market trend.
One common market breadth indicator is the Advance/Decline Line, which tracks the cumulative number of advancing stocks minus declining stocks over a given period. A rising Advance/Decline Line suggests that more stocks are participating in an upward move, indicating a healthy and sustainable market rally. On the other hand, a declining Advance/Decline Line may signal weakening market breadth and potential trouble ahead for the market.
Another popular market breadth indicator is the Percentage of Stocks above Moving Averages, which measures the percentage of stocks trading above key moving averages, such as the 50-day or 200-day moving average. A high percentage suggests widespread strength in the market, while a low percentage may signal underlying weakness and potential turbulence.
In conclusion, monitoring market breadth is essential for investors to gain insights into the underlying strength or weakness of a market trend. By paying attention to market breadth indicators, investors can make more informed decisions and better navigate the complexities of financial markets. Remember, a healthy market breadth supports a sustainable market move, while weak market breadth could be a warning sign of possible trouble ahead.


