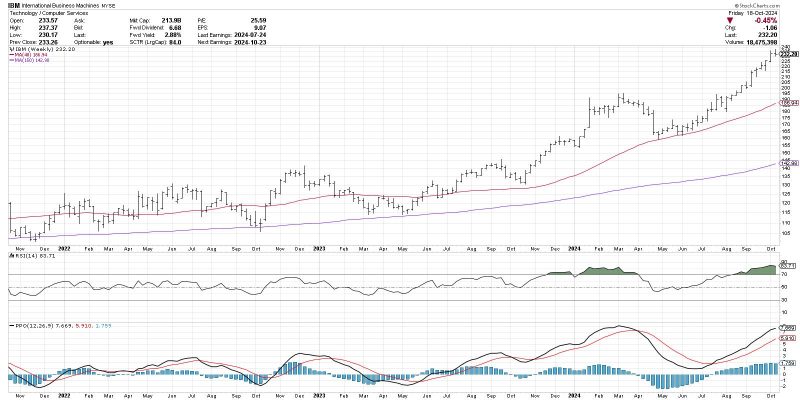
The MACD Histogram: A Powerful Tool for Predicting Trend Changes
Understanding market trends and identifying potential changes is a crucial aspect of successful trading. Traders often rely on various technical indicators to gain insights into market dynamics and make informed decisions. One such indicator that has gained popularity among traders is the MACD Histogram.
The MACD Histogram is a derivative of the Moving Average Convergence Divergence (MACD) indicator, a momentum oscillator that measures the relationship between two moving averages of an asset’s price. While the MACD itself provides valuable information about trend strength and potential reversals, the MACD Histogram takes this analysis a step further by plotting the difference between the MACD line and its signal line.
The Histogram’s unique visual representation of the gap between the MACD and its signal line provides traders with a more granular view of momentum shifts in the market. By analyzing the Histogram’s bars, traders can identify subtle changes in momentum and anticipate potential trend reversals before they occur.
One key feature of the MACD Histogram is its ability to generate signals through crossovers. When the Histogram bars move above the zero line, indicating that the MACD line is above the signal line, it suggests a bullish trend. Conversely, when the Histogram bars dip below the zero line, signaling that the MACD line is below the signal line, it indicates a bearish trend.
Traders can also look for divergences between the price action and the MACD Histogram to identify potential trend changes. Bullish divergence occurs when the price makes a lower low while the Histogram makes a higher low, signaling that the downtrend may be losing momentum. Conversely, bearish divergence happens when the price forms a higher high while the Histogram forms a lower high, indicating that the uptrend might be running out of steam.
Another way to utilize the MACD Histogram is by monitoring its slope. A steep incline or decline in the Histogram bars suggests strong momentum in the corresponding direction, which could signal a continuation of the current trend. On the other hand, a flattening Histogram indicates weakening momentum and a possible trend reversal.
While the MACD Histogram can be a powerful tool for anticipating trend changes, it is essential to use it in conjunction with other technical indicators and analysis methods. Like any indicator, the Histogram is not foolproof and can generate false signals in certain market conditions. Therefore, it is crucial for traders to practice risk management and validate their findings with additional tools before making trading decisions based on the MACD Histogram alone.
In conclusion, the MACD Histogram offers a valuable perspective on market momentum and trend dynamics, making it a useful tool for traders seeking to anticipate trend changes. By analyzing the Histogram’s crossovers, divergences, and slope, traders can gain insights into potential shifts in market direction and make more informed trading decisions. However, it is essential to use the MACD Histogram in conjunction with other indicators and risk management strategies to maximize its effectiveness and avoid relying solely on its signals.


