


In the world of trading and investing, one of the crucial factors that traders need to identify is the potential distribution phase of a security. Visualizing this phase accurately can provide valuable insights into the future price movements of the asset. In this article, we will discuss three effective ways to visualize the start of a potential distribution phase.
1. Volume Analysis:
Analyzing the trading volume can provide significant clues about the initiation of a distribution phase. During this phase, the trading volume tends to increase as institutional investors and market makers start selling their positions to retail traders. By tracking the volume bars on a price chart, traders can identify increasing selling pressure, indicating a potential distribution phase. An uptick in volume accompanied by a sharp decline in price could signal the beginning of such a phase.
2. Price Patterns:
Price patterns play a crucial role in identifying the start of a potential distribution phase. One common pattern that often emerges during this phase is the head and shoulders pattern. This pattern consists of a peak (head) with two smaller peaks on either side (shoulders). The formation of this pattern indicates a shift in market sentiment from bullish to bearish, signaling a potential distribution phase. Traders can use this pattern as a visual cue to prepare for a possible downtrend in the asset’s price.
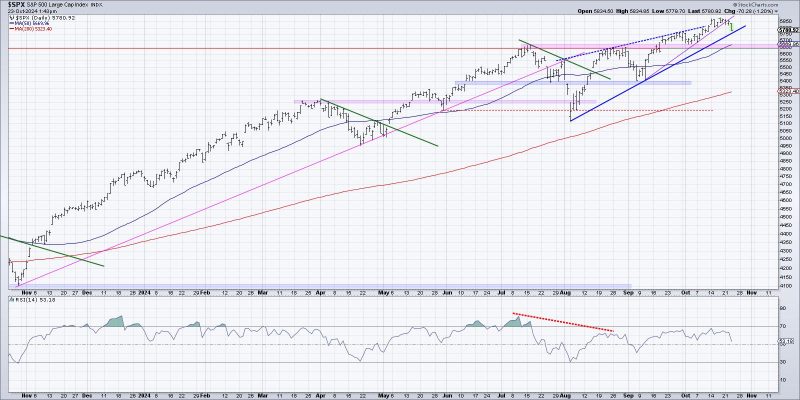
3. Moving Averages:
Utilizing moving averages can also help traders visualize the start of a distribution phase. By plotting different moving averages on a price chart, traders can identify the crossing of shorter-term moving averages below longer-term moving averages. This crossing, known as a death cross, indicates a potential shift in trend direction from bullish to bearish. Traders can use this visual signal to confirm the onset of a distribution phase and adjust their trading strategies accordingly.
In conclusion, visualizing the start of a potential distribution phase is essential for traders to make informed decisions and manage their risk effectively. By incorporating volume analysis, price patterns, and moving averages into their technical analysis toolkit, traders can enhance their ability to identify and respond to the early signs of a distribution phase. Stay vigilant, keep an eye on these visual cues, and adapt your trading strategies to navigate through this critical phase successfully.


